
 Vitalii Holben
7% of Amazon Pages Returned Errors With HTTP 200. Here's the Proof.
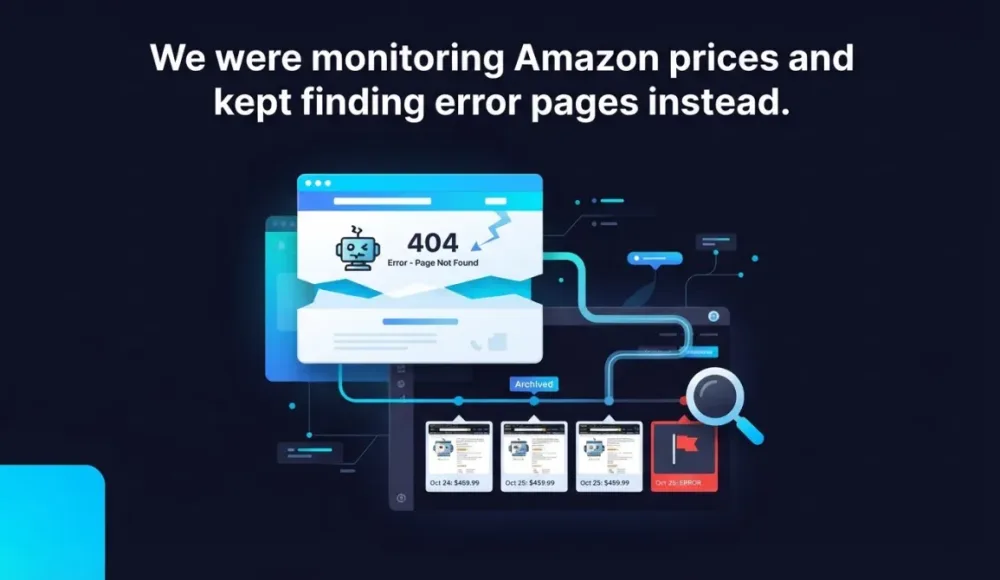
We were tracking Amazon product pages for price changes. Set up a handful of monitors, daily screenshots, nothing fancy. A few days in, we noticed something odd: some of the captures weren't product pages at all. They were error screens. "Sorry, something went wrong on our end." But every uptime checker we ran said the pages were fine.
That kept happening for four weeks straight. About 7% of our captures came back broken in some way. Not a single one returned an HTTP error code.
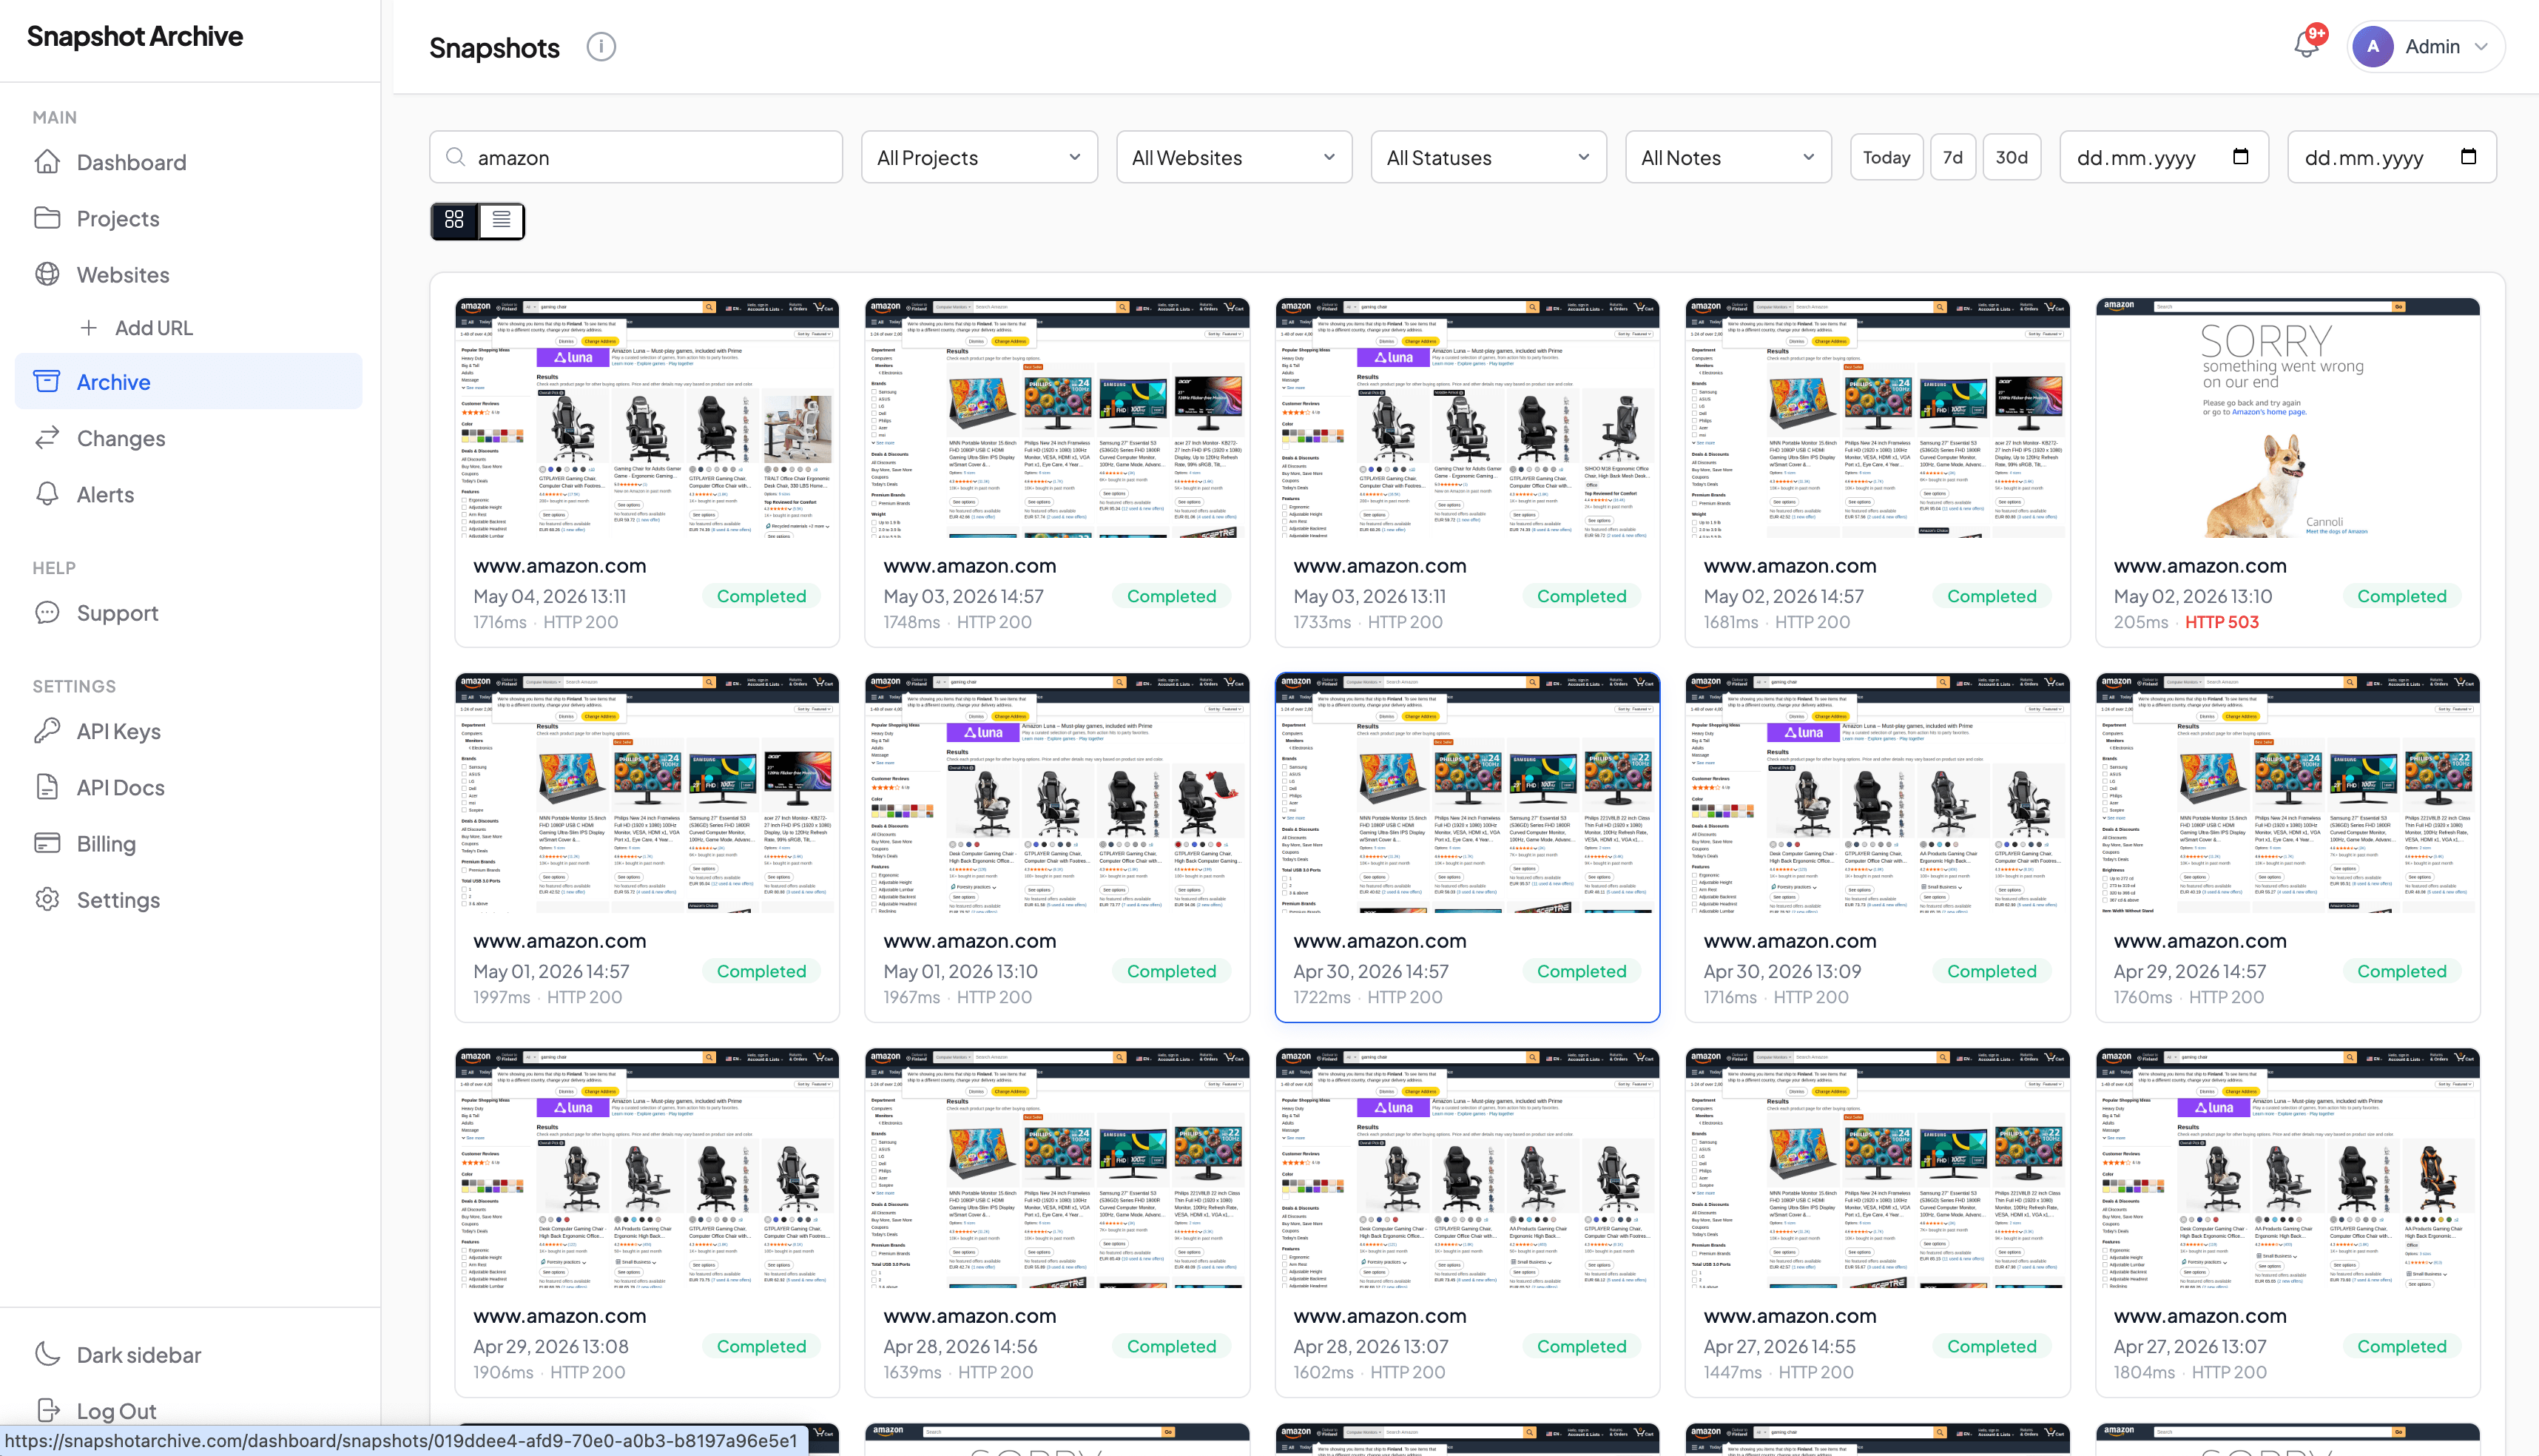
What we kept finding
Most of the broken captures were generic error pages. Amazon serves these all the time, usually during maintenance windows or traffic spikes. The page looks nothing like the product listing, the visual diff is massive, but the status code comes back 200.
Some were CAPTCHA challenges. Amazon's bot detection kicks in and serves a verification page instead of the product. Again, HTTP 200.
The trickiest ones were partial renders. The page structure loaded fine, layout looked normal, but the price was missing and the buy button was gone. Those are easy to miss because the page looks "close enough" at a glance. We almost raised the change detection threshold and filtered them out. Would have missed every one.
This isn't an Amazon thing
eBay does the same. We caught their "SORRY Something went wrong" page during the same period. HTTP 200.
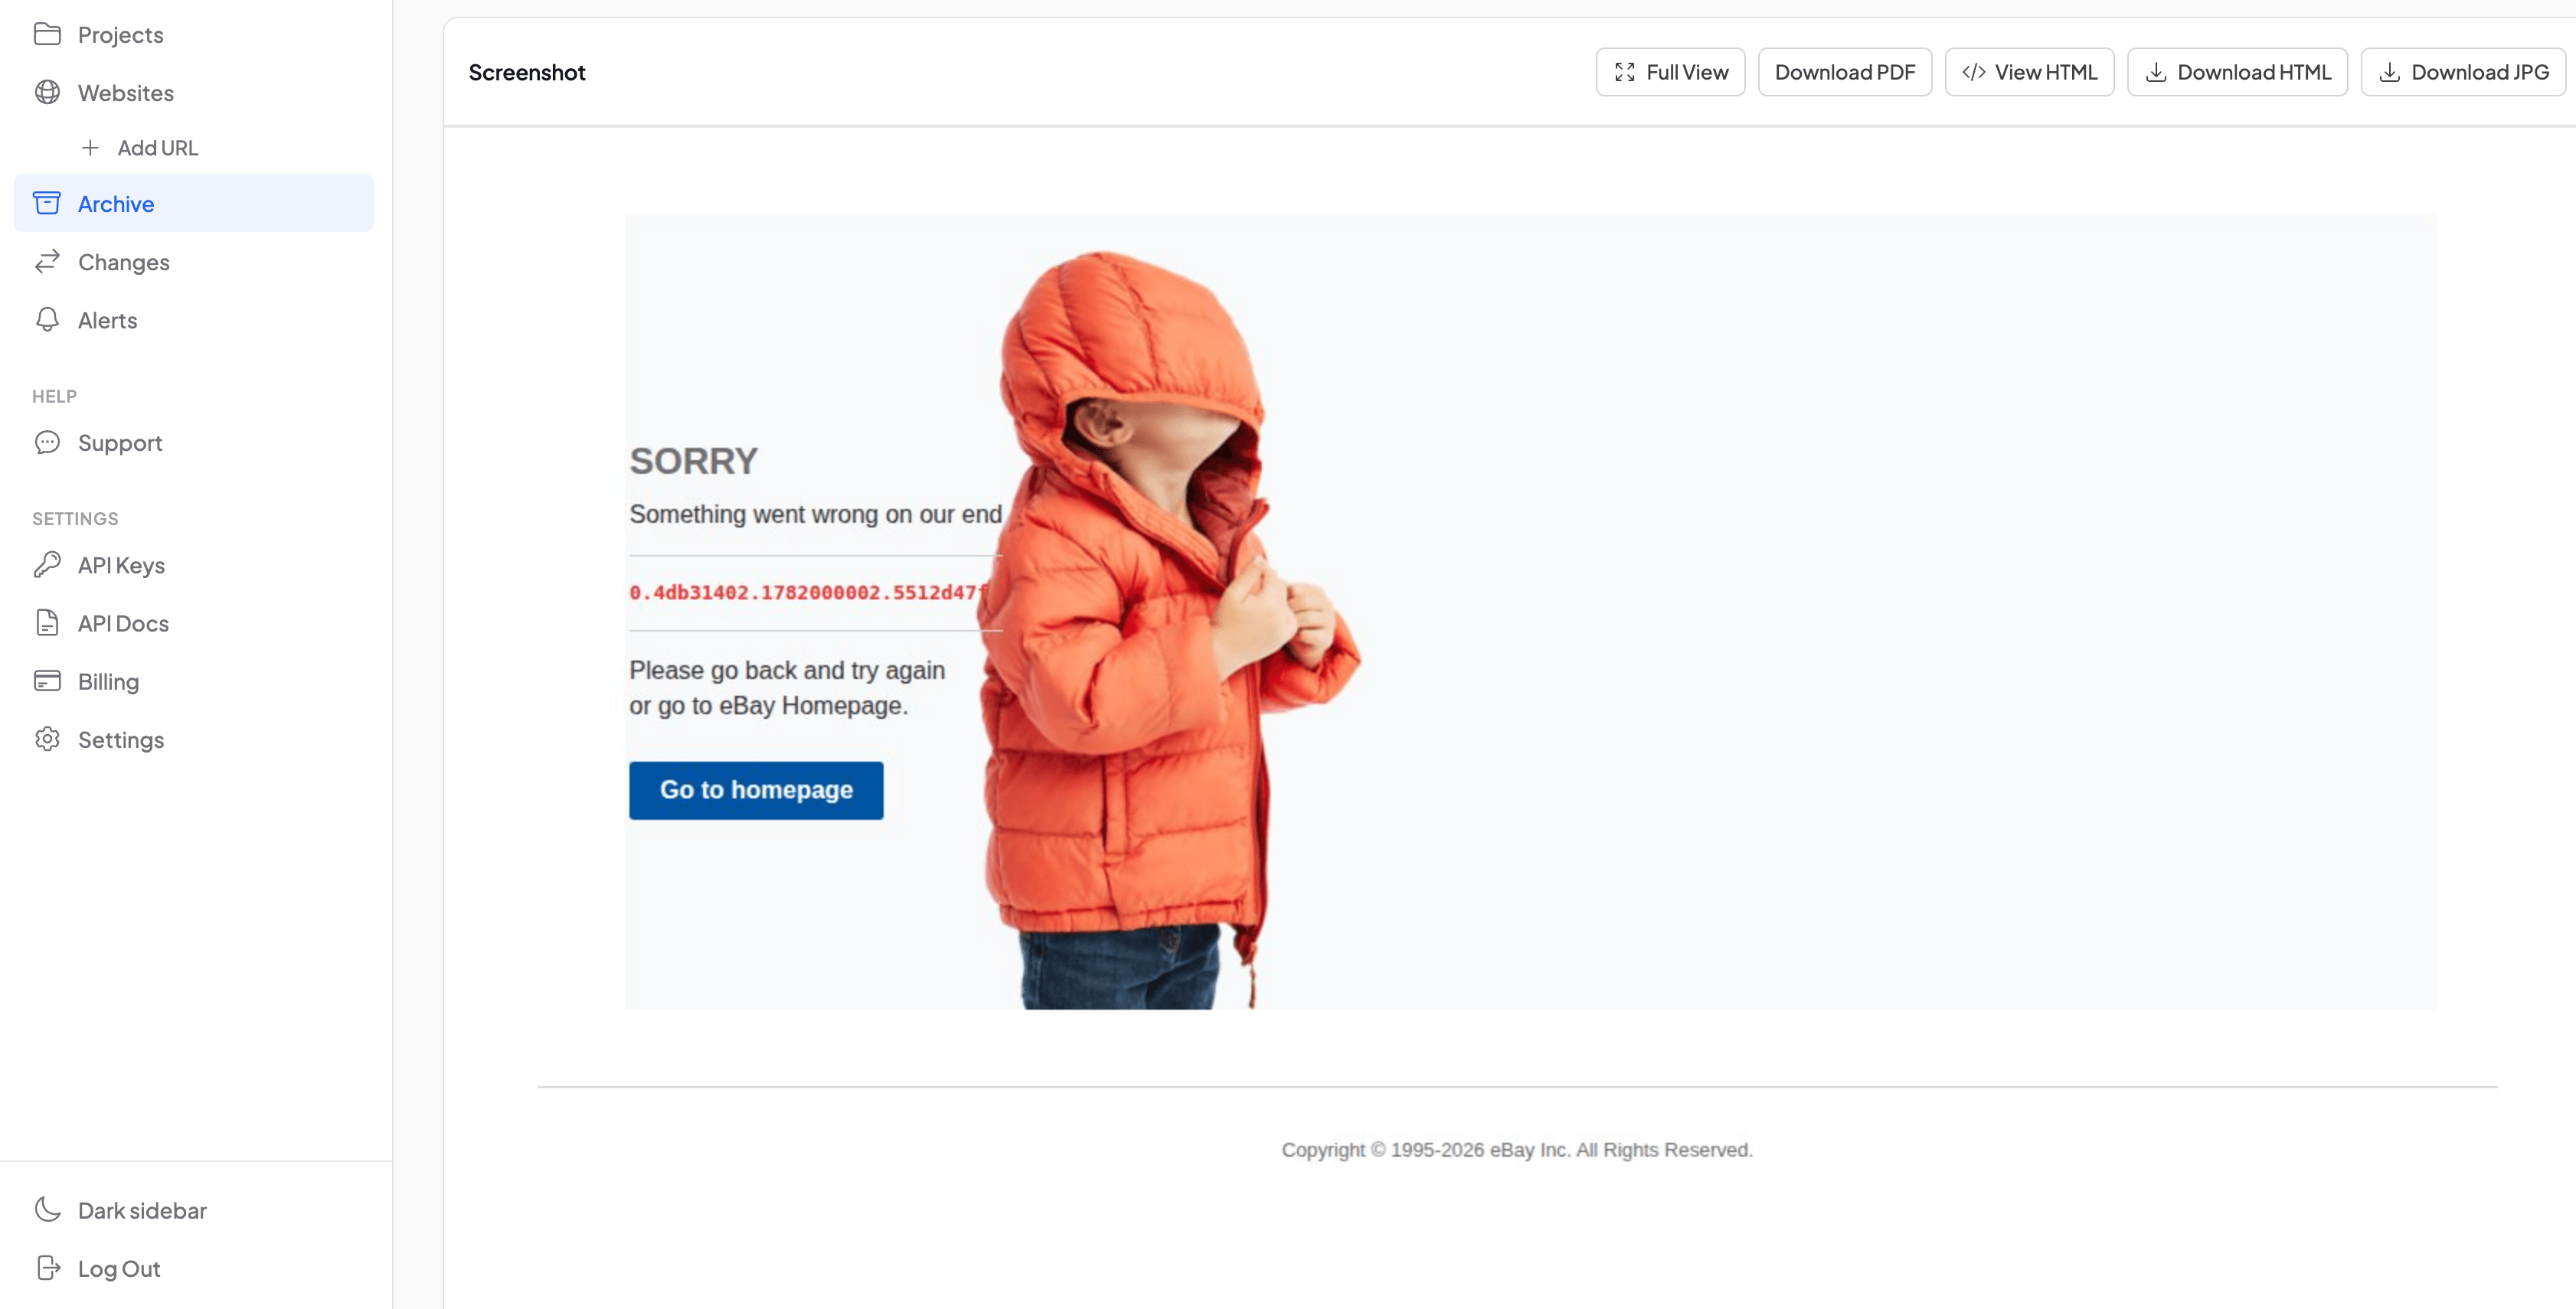
Any site that catches an internal error and renders a friendly error template instead of crashing will do this. The server handled the request, returned a response, status code 200. The fact that the response is an error page doesn't change the code.
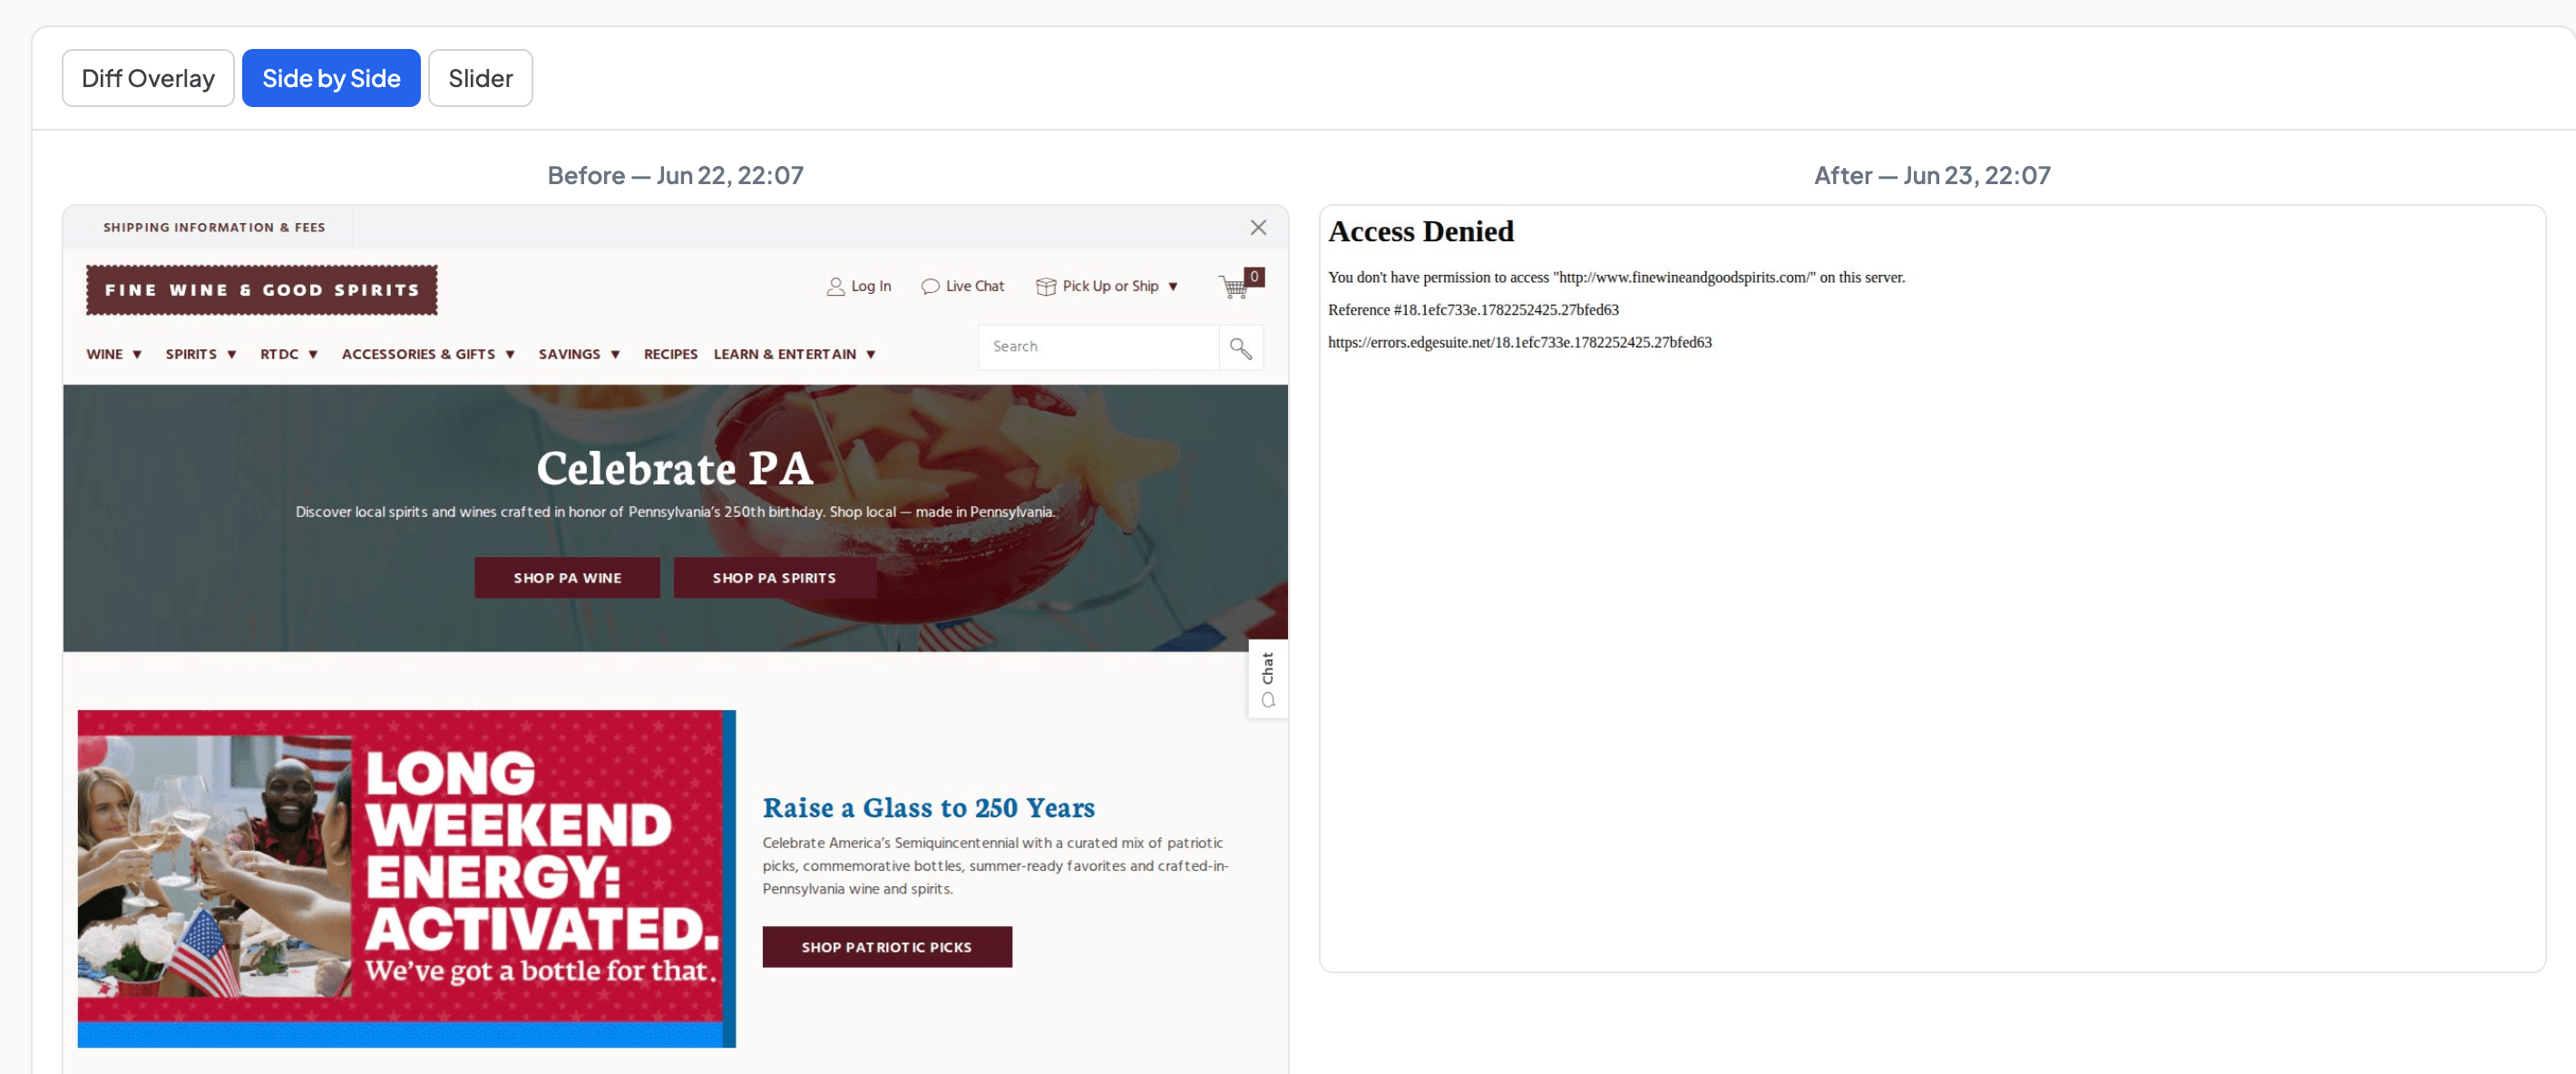
CDNs make it worse. If your origin goes down and Cloudflare has a cached copy, it'll keep serving that cached page with a 200 for up to two hours. Your monitoring says everything's fine. Your visitors might be looking at yesterday's prices or a stale error page.
Why uptime monitors don't catch this
Uptime tools send a request and check the response code. Some verify that a specific text string exists in the HTML. That's about it.
None of them actually render the page.
Modern pages assemble themselves client-side. If the product API times out, the HTML shell still loads with a 200. The server did its part. The page didn't. A ping monitor has no way to know the difference.
The errors had a pattern
They weren't random. Roughly 40% showed up during late-night maintenance windows, 1am to 4am UTC. The rest clustered during peak traffic hours, mid-afternoon US Eastern. If you only check during business hours, you'd never see the first group. Your customers in other time zones would.

Anyone who's dealt with broken deploys knows this pattern. Deploy goes out, CDN cache clears, and for a few minutes some visitors get a broken experience. Post-deployment monitoring catches this on your own site. But when you're tracking a competitor's pages, nobody sends you deploy notifications.
What screenshots catch that pings miss
Scheduled screenshots render the full page in a real browser, JavaScript and all. When that capture gets compared to the previous one through visual diff, an error page replacing a product listing is impossible to miss.
| What happens | Uptime monitor | Screenshot |
|---|---|---|
| Error page with 200 status | All clear | Alert triggered |
| CAPTCHA instead of content | All clear | Alert triggered |
| Price and buy button missing | All clear | Flagged for review |
| CDN serves stale cached page | All clear | Content mismatch detected |
| CSS/JS fails to load | All clear | Layout broken, alert triggered |
Alerts fired on most of our error captures. The obvious ones were easy. The partial renders needed manual review because they looked similar enough to normal page updates. We're still figuring out how to reliably tell the difference between a missing price block and a redesigned one. Haven't cracked that yet.
What a 200 actually tells you
A 200 status code means the server answered. It doesn't mean the page works. If you're running a standard uptime check on ecommerce pages, yours or a competitor's, you're probably missing things.
We're not saying drop your uptime tools. Keep them. But screenshots show you what the page actually looked like, not just whether the server responded. We wrote up how to set up visual availability monitoring if you want to try it.
The 7% failure rate we saw on Amazon probably isn't typical. But the gap between "server responded" and "page works" exists everywhere. Most monitoring setups just aren't built to see it.
Start archiving websites today
Free plan includes 3 websites with daily captures. No credit card required.
Create free account
We Tried Monitoring Competitors Manually. Here's Why We Stopped.
We monitored competitors manually for two weeks before the gaps, inconsistent naming, and missed pricing changes convinced us to automate. The difference was immediate.
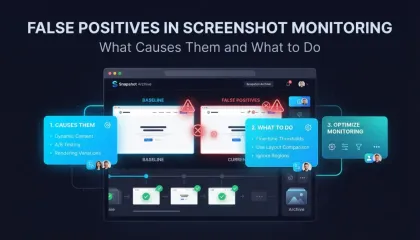
False Positives in Screenshot Monitoring: What Causes Them and What to Do
We got 14 alerts in one day from a single website. The problem was a live counter and a logo carousel triggering visual diff on every capture. Here is how we fixed it with threshold tuning and hide selectors.

90% of Automated Screenshots Work. The Other 10% Made Us Build a Button.
Screenshots break. Now you can report problems without leaving your dashboard — we get the full context automatically.